A single month of household energy data can tell an auditor how much electricity or fuel a home used during a particular billing period, but it rarely explains whether that pattern is temporary or persistent. Weather, occupancy, vacations, equipment schedules, and unusual household activity can all distort a short observation window. When records are extended across multiple seasons or several consecutive years, however, recurring relationships become easier to distinguish from one-time events.
Longitudinal analysis is particularly useful because residential energy use is not driven by a single variable. Heating and cooling respond to outdoor conditions, water heating follows household routines, appliances introduce intermittent loads, and changes in occupancy can alter the entire daily profile. A multi-month or multi-year record provides enough context to examine these influences together rather than treating every increase in consumption as evidence of declining efficiency. The goal is not simply to produce a longer chart; it is to determine which patterns remain after weather and other major changes have been taken into account.
The first value of a longer dataset is that it establishes a reference point against which unusual consumption can be evaluated. A single July bill may show unusually high electricity use, but the number alone cannot reveal whether the increase came from extreme outdoor temperatures, a change in thermostat settings, additional occupants, an equipment problem, or some combination of these factors. Comparing the same home's consumption across multiple summers and winters provides a much stronger basis for identifying recurring relationships.
Weather normalization is particularly important when the objective is to compare different periods. Heating degree days (HDDs) and cooling degree days (CDDs) provide a way to relate heating and cooling demand to outdoor temperatures, although they are not a complete description of building performance. A home that consumes more electricity during a colder winter should not automatically be considered less efficient than it was during a milder winter. Likewise, a higher summer total may simply reflect a longer or hotter cooling season rather than deterioration in the air-conditioning system.
For that reason, analysts may examine energy use alongside HDDs and CDDs, compare similar weather periods, or use statistical models to estimate the weather-sensitive portion of consumption. The resulting baseline is not a perfectly clean separation between “efficient” and “inefficient” energy use. Instead, it is a more defensible estimate of how much consumption appears to vary with weather and how much remains relatively persistent. That distinction matters because the persistent component can include refrigeration, networking equipment, standby electronics, ventilation, pumps, and other loads that operate continuously or frequently cycle, while water heating, lighting, and other household services can occupy more variable positions in the load profile.
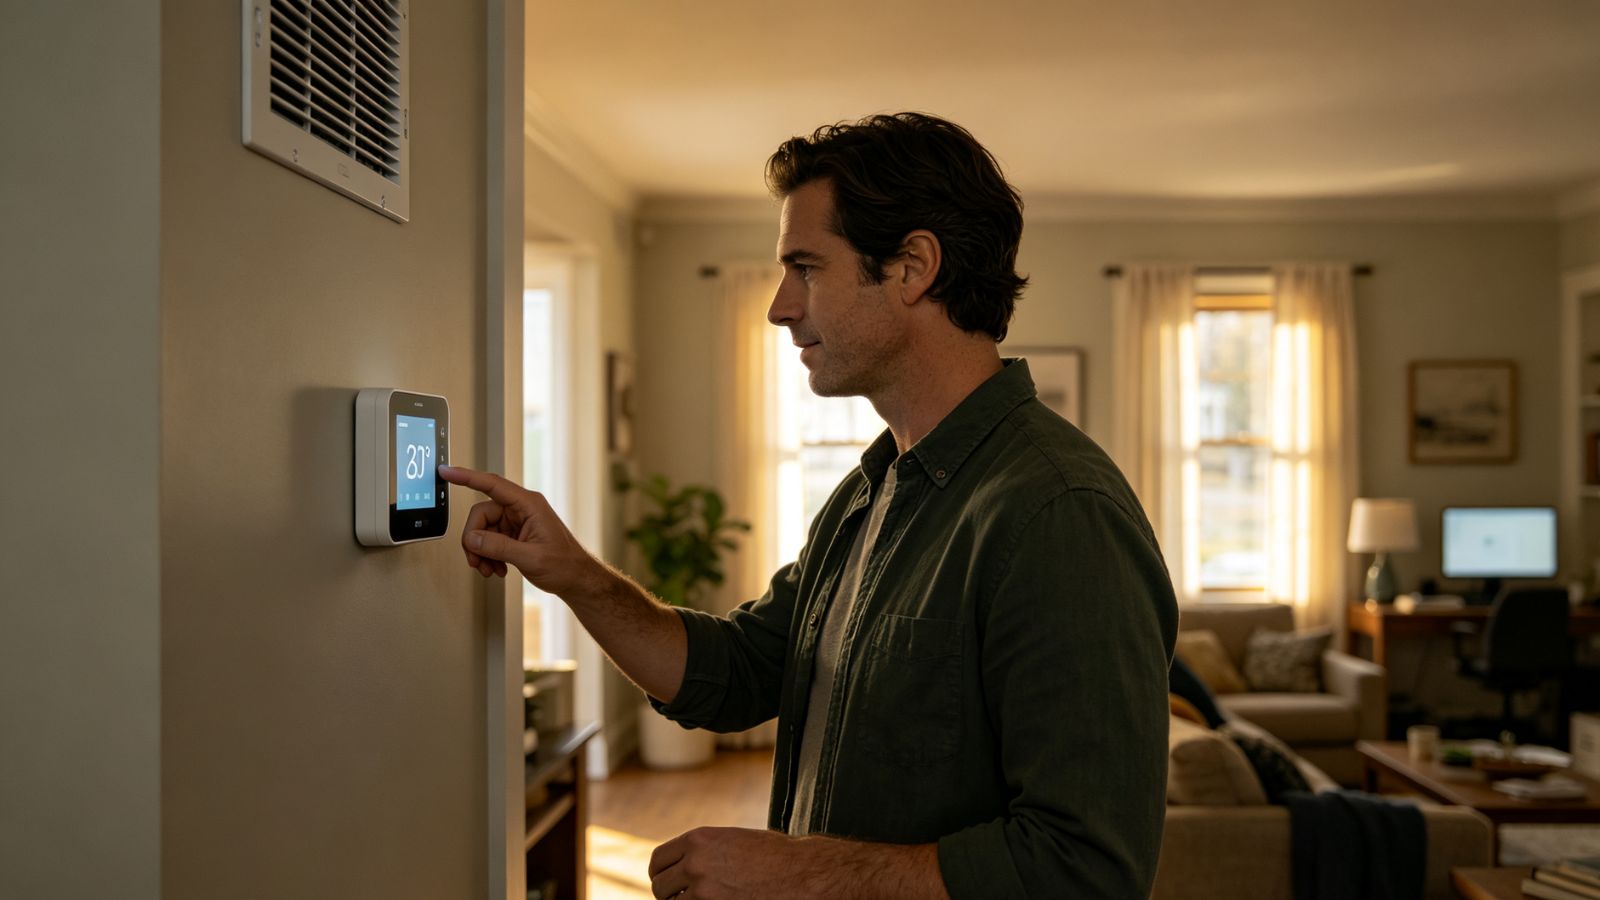
Residential energy consumption is strongly seasonal, but the shape and intensity of that seasonality vary from year to year. A home in a hot climate may show a pronounced summer electricity peak because of air conditioning, while a home that relies on electric heat may experience its largest electricity demand during winter. Homes using natural gas or another fuel for space heating can show a very different electricity profile because much of the seasonal heating load does not appear in electric meter data.
A multi-year record makes it possible to compare these seasonal patterns without treating every annual difference as a structural change. For example, if July electricity consumption is higher in one year than the previous year, the next question should be whether July weather was also more demanding. If energy use increases even after comparable weather conditions are considered, the difference becomes more interesting, but it still does not establish a single cause. Changes in occupancy, thermostat behavior, appliance ownership, operating schedules, or equipment condition can all produce similar trends.
This is where longitudinal analysis becomes more useful than simply looking for an upward or downward line. Analysts can examine energy intensity relative to weather, compare recurring seasonal periods, and look for changes that persist across several observations. A pattern that appears only during one unusually hot month deserves a different interpretation from a gradual increase in weather-normalized cooling consumption that continues for several years. The former may be an anomaly; the latter is a reason to investigate further.
Long-term records become especially valuable when something changes inside the home. Installing a heat pump, replacing a water heater, adding an electric vehicle, changing thermostat schedules, or moving from one type of utility rate to another can alter the load profile substantially. Without a sufficiently long record, it can be difficult to distinguish the effect of the new equipment from ordinary seasonal variation.
Consider a household that replaces an older air conditioner with a higher-efficiency system. Electricity consumption may decline during comparable cooling periods, but the reduction cannot automatically be attributed entirely to the equipment. The household may also have changed thermostat settings, altered occupancy patterns, improved insulation, or experienced different weather. Conversely, an efficient new system may not produce a large reduction in total electricity use if occupants subsequently maintain a cooler indoor temperature or use the home more intensively.
The same principle applies to behavioral changes. A smart thermostat or time-of-use electricity rate may initially produce a noticeable change in when electricity is consumed, but the long-term question is whether that change persists. A household might shift laundry and dishwashing away from expensive periods for several months and then gradually return to its previous routine. Multi-year data can reveal whether a behavioral intervention produced a durable change or merely a short-lived response to a new technology, rate structure, or awareness campaign.
One of the most important disciplines in long-term energy analysis is distinguishing a useful signal from an unsupported causal conclusion. A persistent increase in electricity use can be meaningful without revealing its cause by itself. If consumption rises after several years of stable operation, an analyst may investigate equipment performance, duct leakage, insulation condition, occupancy changes, operating schedules, or newly added electrical loads. The meter data establishes that something changed; physical inspection and additional records help determine why.
This distinction is particularly important when evaluating the condition of mechanical equipment. Air conditioners and heat pumps can experience reduced performance because of fouled coils, airflow problems, component wear, refrigerant leaks, improper refrigerant charge, or other maintenance and installation issues. A long-term increase in energy use under comparable operating conditions can provide evidence that further investigation is warranted, but it should not be treated as proof that a specific component has failed.
The same reasoning applies to the building envelope. Changes in air leakage, insulation condition, duct performance, or moisture-related building problems can affect heating and cooling demand, but utility data alone generally cannot identify the physical location of a problem. A useful diagnostic process therefore treats the long-term consumption trend as one source of evidence and combines it with inspection findings, equipment records, maintenance history, and, when appropriate, more detailed measurements.
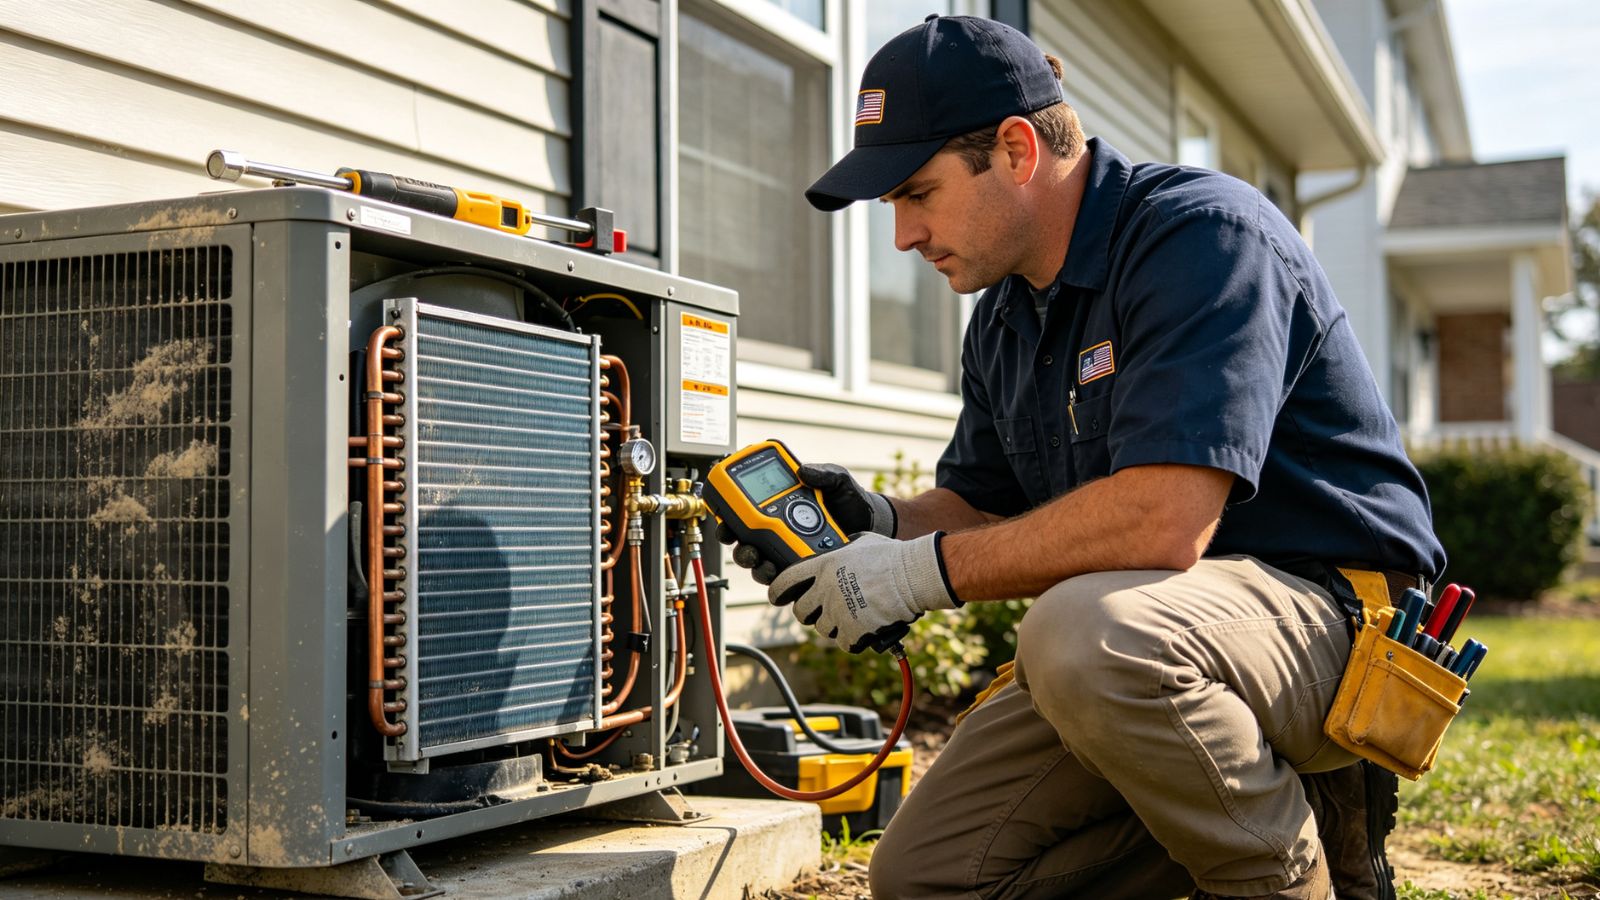
One of the strongest applications of longitudinal analysis is measuring what happened after an energy improvement was completed. Projected savings calculated before a retrofit are based on assumptions about weather, equipment operation, occupancy, and future energy use. Actual performance can differ because the completed project interacts with the real building and the people who live in it.
A meaningful before-and-after comparison therefore requires more than subtracting one year's utility consumption from another year's total. Analysts should consider whether the pre- and post-retrofit periods experienced comparable weather and whether major changes occurred in occupancy, equipment, operating schedules, or energy prices. Where appropriate, weather normalization can help separate the effect of the retrofit from differences in heating and cooling conditions.
For example, if attic insulation and air sealing are completed before a winter, a lower electricity or natural-gas total in the following year may be consistent with improved envelope performance. But the strength of that conclusion depends on the surrounding evidence. If the following winter was substantially milder, the household spent several weeks away, and the heating system was also replaced, the utility reduction cannot reasonably be assigned to insulation and air sealing alone.
Longitudinal evaluation becomes much stronger when several indicators point in the same direction. A sustained reduction in weather-normalized heating consumption, combined with physical evidence that envelope improvements were completed as intended, provides a more credible assessment than a simple year-over-year bill comparison. The same principle can be applied to HVAC replacements, water-heating upgrades, duct sealing, and other projects whose effects should be evaluated against the conditions under which the equipment actually operated.
Total annual consumption is useful, but it can obscure important changes in how a home performs. Energy intensity provides another way to examine the data by relating consumption to a relevant driver such as conditioned floor area, heating degree days, cooling degree days, or another measurable factor.
Suppose a household's annual electricity consumption increases after an additional family member moves into the home. The total number of kilowatt-hours may rise even though the building and mechanical systems have not become less efficient. Conversely, total consumption might remain relatively stable even while the underlying efficiency of a heating or cooling system declines because occupants use less conditioned space or spend more time away from home.
Looking at energy consumption in relation to the conditions that drive it can therefore reveal changes that a simple annual total misses. This does not mean that a single intensity metric can fully characterize a home's efficiency. Rather, it provides another analytical lens that can be compared with weather data, occupancy information, equipment history, and physical observations. The more closely these independent sources agree, the stronger the interpretation becomes.
Long-term records can be useful for identifying performance changes associated with aging equipment, but the relationship is rarely as simple as an appliance getting older and automatically consuming more electricity. Some equipment can maintain relatively stable performance for many years when properly maintained, while other systems may experience problems sooner because of installation conditions, operating stress, airflow restrictions, component failures, or inadequate maintenance.
The most useful signal is therefore not simply age but a persistent change in energy performance under reasonably comparable conditions. If a cooling system repeatedly consumes more electricity for similar weather conditions while providing the same service, that pattern can justify additional diagnostic work. Equipment age and maintenance history then become part of the larger assessment rather than the sole explanation for the increase.
This approach also helps prevent premature conclusions about replacement. A rising energy trend does not by itself establish that replacement is economically justified. Repair costs, equipment age, expected remaining service life, efficiency improvements available from replacement, installation costs, utility rates, incentives, and the home's future operating requirements all influence that decision. Long-term energy data can strengthen the evidence for a decision, but it should be combined with technical and economic information rather than treated as a standalone replacement rule.
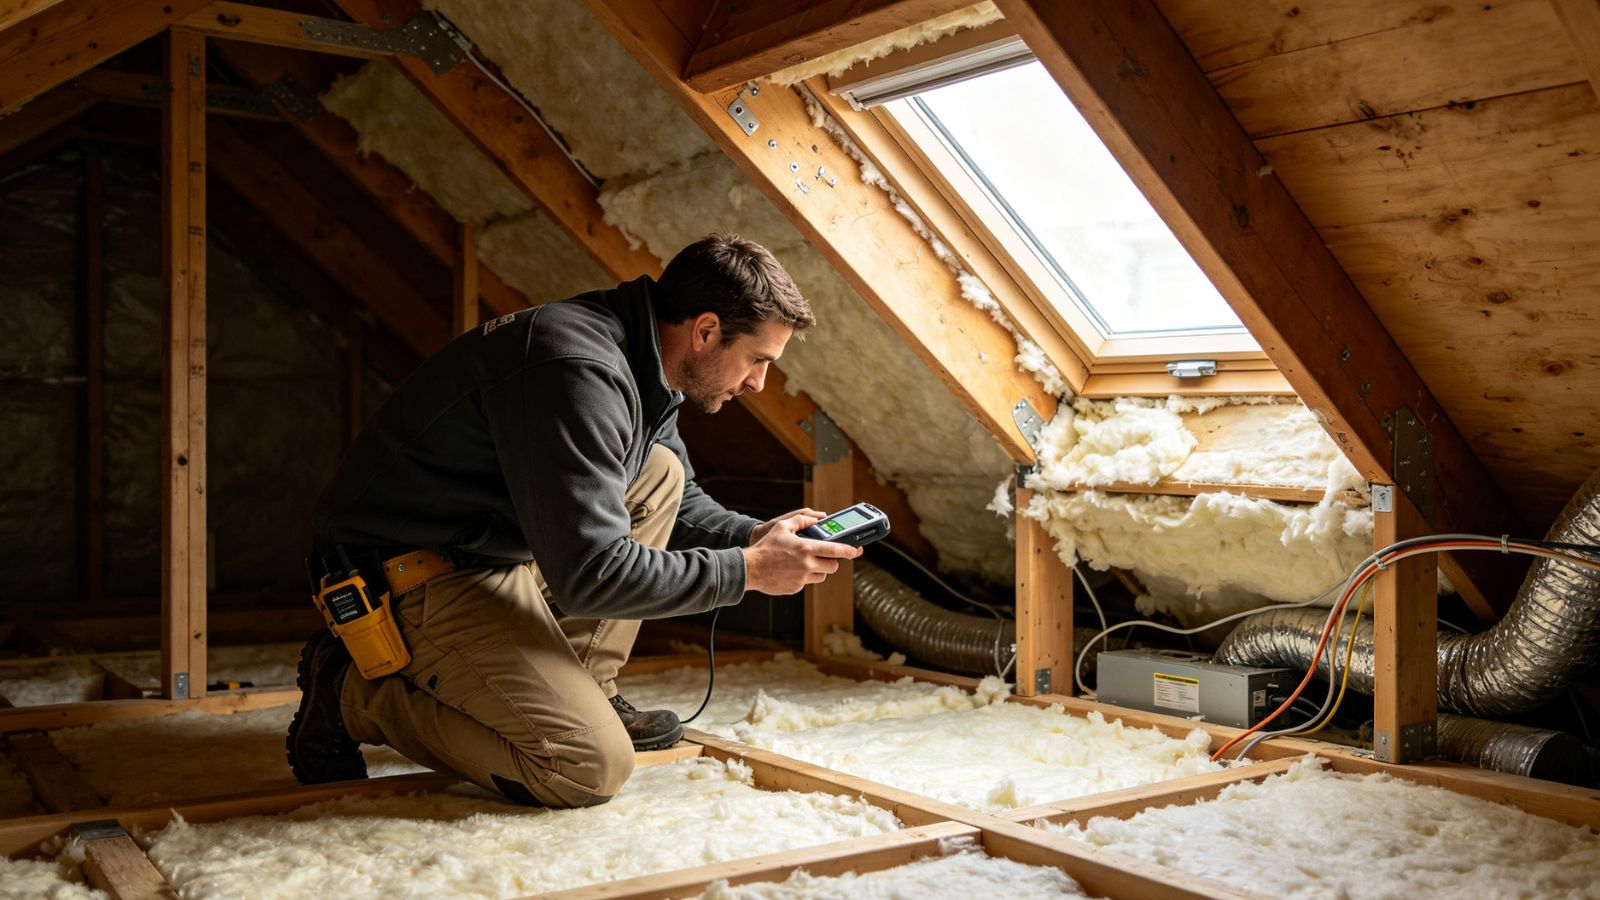
A five-year dataset is not automatically more informative than a one-year dataset simply because it contains more numbers. Its value depends on whether the records are comparable, complete, and properly interpreted. Changes in utility billing structures, missing meter intervals, equipment replacements, additions to the household, changes in conditioned floor area, and major shifts in occupancy can all create breaks in an otherwise continuous record.
Good longitudinal analysis therefore begins by documenting what changed during the observation period. Equipment installation dates, major renovations, occupancy changes, thermostat adjustments, utility rate changes, and unusual periods of vacancy can provide critical context for interpreting the energy record. Without this information, an apparent trend can easily be mistaken for a physical efficiency change when it is actually the result of a change in how the home is used.
The same principle applies to the choice of time period. Multi-month data may be enough to establish a seasonal baseline for a specific question, while several years may be necessary to evaluate persistent trends or retrofit performance. There is no universal number of months that guarantees a reliable conclusion. The appropriate observation window depends on the question being asked, the variability of the home's energy use, the availability of weather data, and the quality of the historical records.
Multi-month and multi-year household energy records provide something that a single utility bill cannot: context. They make it possible to compare seasons, identify recurring load relationships, examine weather-normalized trends, and evaluate how equipment, occupancy, and household behavior change over time. Most importantly, they allow analysts to distinguish persistent patterns from isolated events without assuming that every change has a single obvious cause.
The strongest conclusions come when long-term meter data is treated as part of a broader evidence set. Utility records can establish the historical pattern; weather data can explain part of its variation; equipment and occupancy records can identify important changes; and on-site inspection can test physical explanations suggested by the numbers. When these sources point toward the same conclusion, a household's energy history becomes much more than a collection of monthly bills. It becomes a practical record of how the building, its equipment, and its occupants have interacted over time—and a stronger foundation for evaluating what has changed, what may require further investigation, and whether an energy improvement has produced a durable result.
