A monthly utility bill can tell a homeowner how much electricity was consumed, but it reveals very little about how that electricity was used. Once consumption is recorded at shorter intervals, however, the shape of household demand begins to reveal recurring patterns. Morning increases, midday plateaus, evening peaks, overnight baseloads, and differences between weekdays and weekends can all provide clues about when a home is occupied and how its electrical systems operate.
That does not mean a smart meter creates a literal record of everything people do. Electricity data is an indirect measurement, and the same load pattern can often be produced by several different combinations of appliances, schedules, weather conditions, and occupant behavior. The useful analytical question is therefore not whether a meter can identify a person's routine with certainty, but whether repeated changes in electricity demand can provide evidence about occupancy patterns and behavioral shifts. When interpreted cautiously, interval data can reveal relationships between human activity and the operation of household electrical systems that are largely invisible in a monthly bill.

One of the clearest ways human presence can affect residential electricity demand is through the transition between unoccupied and occupied periods. During overnight hours or while a household is away, electricity use may settle toward a relatively stable baseline created by refrigeration, networking equipment, standby electronics, security systems, ventilation, and equipment that cycles automatically. When occupants begin using the home, additional loads appear and the overall profile becomes more variable.
A morning routine can produce a recognizable cluster of activity. Electric coffee makers, kettles, hair dryers, lighting, cooking equipment, and HVAC systems may all operate within a relatively short period, producing a temporary increase in demand. The exact pattern varies substantially by household, however. A home with gas cooking and gas water heating will produce a different electrical signature from an all-electric home, while a household with a delayed heating schedule may show a different morning profile from one that conditions the house before occupants wake.
The more useful observation is therefore the transition itself rather than any individual appliance. If electricity demand repeatedly rises during a particular morning window and then falls for several hours, that pattern may be consistent with occupants leaving the home. When a similar increase occurs again later in the day, it may correspond with a return to normal household activity. Repeated patterns across many days provide stronger evidence than a single unusual spike because they reduce the chance that weather, appliance operation, or an isolated event is being mistaken for a behavioral pattern.
Occupancy-related patterns become easier to examine when electricity data is compared across multiple days rather than viewed as an isolated twenty-four-hour period. A household with regular weekday absences may show a relatively consistent morning increase followed by lower midday demand and a second rise later in the afternoon or evening. On weekends, those transitions may become less pronounced because occupants spend more time at home during the day.
The difference does not necessarily identify a particular type of household. A midday increase could indicate that people are working from home, that someone is regularly present during the day, or simply that a major appliance happens to operate during those hours. Likewise, a quiet weekday profile does not prove that nobody is home. Some occupants may remain in the house while using very little electricity, while automated equipment may continue operating even when the building is empty. Interval data is therefore better suited to identifying patterns of electrical activity associated with occupancy than to making definitive claims about who is present.
This distinction matters when analyzing residential energy data at scale. Researchers and utilities can compare recurring load shapes to study how electricity demand responds to schedules, weather, pricing, and technology adoption, but the conclusions become weaker when the analysis moves from aggregate patterns to individual household behavior. The same electrical signature can have multiple explanations, so robust analysis normally combines interval data with contextual information rather than treating the meter signal as a complete behavioral record.
Occupancy is only part of the story. A household's electricity profile also contains a persistent background layer that remains present even when occupants are sleeping or away. This baseload can include refrigerators, internet equipment, security systems, ventilation equipment, standby electronics, pumps, and other devices that either operate continuously or cycle automatically.
The level and shape of this baseline can change as households add or remove equipment. A new home network, additional computer equipment, a second refrigerator, an aquarium system, or permanently connected entertainment devices may gradually raise the background load. Conversely, replacing inefficient equipment or eliminating unnecessary standby consumption can lower it. These changes may be difficult to notice on an ordinary monthly bill because they are mixed into total consumption, but they can become more visible when electricity use is examined at shorter intervals.
Baseline analysis also demonstrates why electricity data should not be interpreted too literally. A high overnight load does not necessarily mean occupants are wasting energy, just as a low overnight load does not prove unusually efficient behavior. Refrigeration, heating, cooling, water circulation, and other automated systems can dominate the background signal. The analytical value comes from examining how the baseline changes over time and how those changes correspond with known changes in equipment or household operation.
One of the biggest challenges in interpreting residential load profiles is separating human behavior from the automatic operation of electrical equipment. Many modern household systems respond to conditions rather than direct human interaction. HVAC systems cycle according to indoor temperature, refrigerators respond to internal temperature, heat pump water heaters follow control logic, and smart appliances may operate according to programmed schedules.
As a result, a rise in electricity demand does not necessarily represent an occupant actively using electricity at that moment. A summer afternoon peak, for example, may primarily reflect outdoor temperature and air-conditioning operation rather than an increase in household activity. Similarly, an overnight increase could be caused by a heating cycle rather than by occupants remaining awake. Weather data, equipment characteristics, and historical load patterns are therefore important controls when analysts attempt to interpret behavior from electricity consumption.
This is one reason repeated observations are more valuable than isolated events. If a particular load increase appears at roughly the same time under similar conditions across many days, it becomes more useful as evidence of a recurring operating pattern. If the same increase occurs only during unusually hot or cold weather, the stronger explanation may be thermal demand rather than occupancy. Good analysis treats the electricity signal as evidence to be interpreted rather than as a direct translation of human activity.
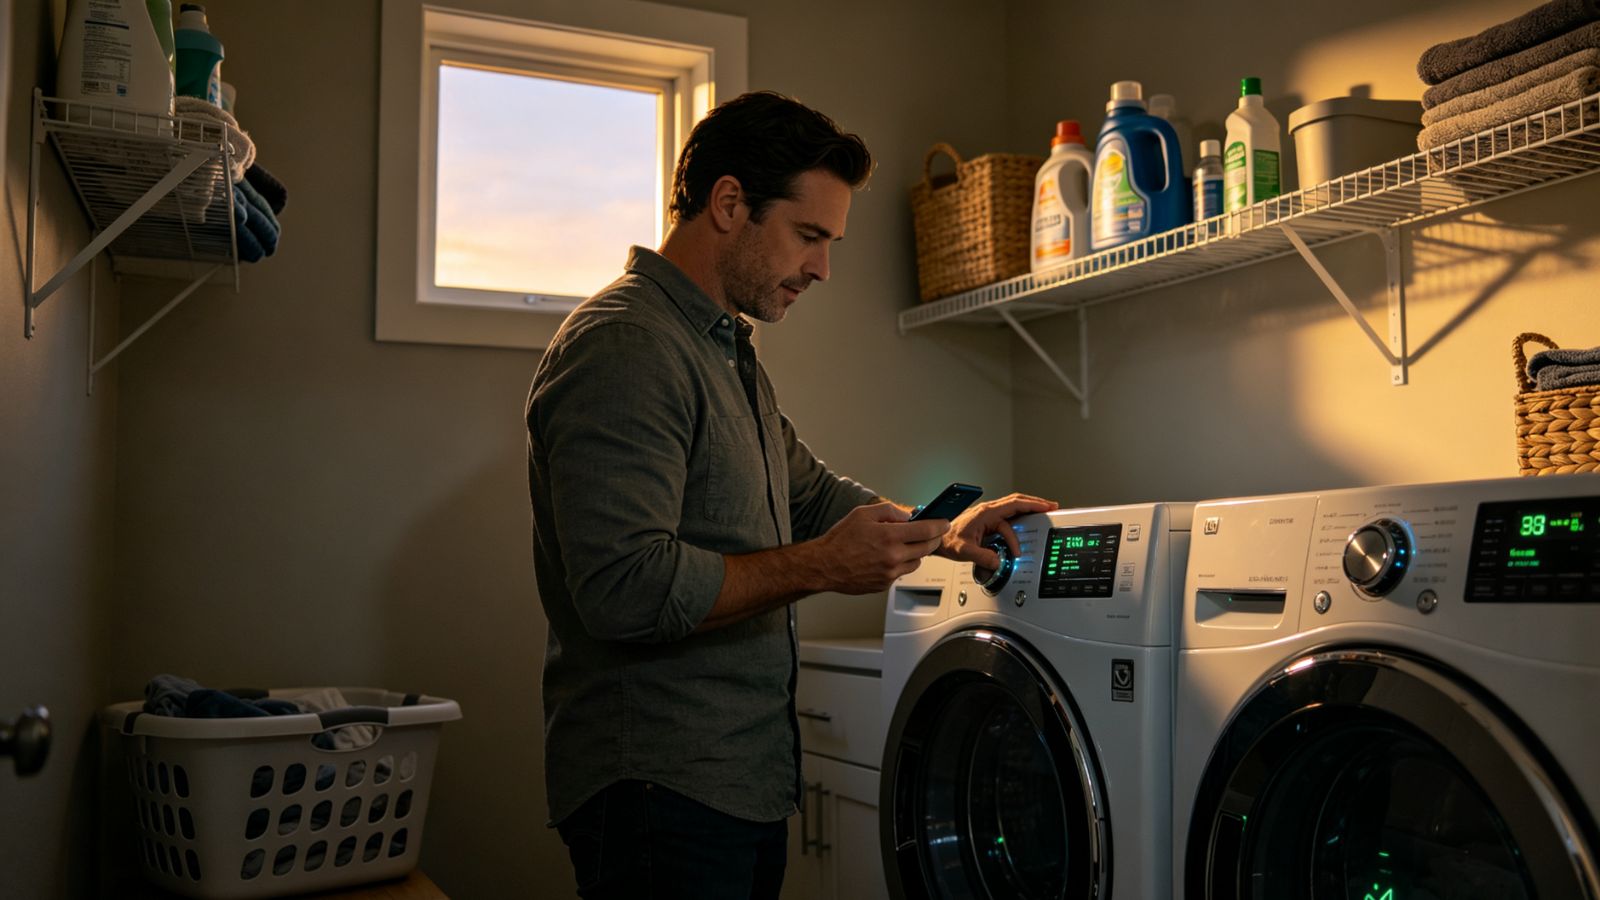
The relationship between people and electricity data is not one-way. Households can influence their electricity profile, but the information provided by smart meters, in-home displays, utility dashboards, and energy-management applications can also influence household behavior. Once previously invisible consumption becomes visible, occupants may change when and how they use electricity.
The effect is particularly clear when consumers receive information about time-based electricity prices or unusually high consumption. A homeowner who discovers that laundry or dishwashing coincides with expensive peak periods may move those activities to another part of the day. Someone who notices a consistently high overnight baseline may investigate always-on equipment. Another household may respond to a high summer bill by changing thermostat settings or examining HVAC performance.
These changes can appear in interval data as shifts in the timing, duration, or magnitude of recurring loads. A flexible appliance may move from afternoon to evening, an overnight baseline may decline after unnecessary equipment is disconnected, or a household's overall peak may become less pronounced after several major loads are intentionally separated. The important point is that the resulting change does not necessarily come from using less electricity overall. In some cases, the household is simply changing when electricity is consumed in response to information about prices or system demand.
Behavioral feedback often begins with awareness, but awareness does not automatically produce lasting savings. The first stage may involve identifying obvious sources of consumption that were previously overlooked. Once the household understands its load profile, the next step may be to change the timing of flexible activities or adjust operating practices that have a measurable effect on electricity demand.
Load shifting is particularly relevant under time-of-use electricity rates. If a household has flexibility over when to run a dryer, dishwasher, pool pump, or other controllable equipment, interval data can make the relationship between scheduling and electricity costs easier to see. The resulting load profile may show that energy consumption has moved from one period to another without necessarily falling by the same amount. This distinction is important because energy reduction and load shifting are different outcomes: one reduces total consumption, while the other changes its timing.
Over longer periods, some households may establish new routines and the resulting load pattern can become more stable. Others may revert to previous habits, particularly when schedules change or the financial incentive becomes less noticeable. For this reason, feedback should be viewed as an ongoing behavioral mechanism rather than a guaranteed three-stage process that every household follows in exactly the same way.
Despite the analytical value of interval data, residential electricity consumption is an inherently ambiguous signal. Multiple appliances can operate simultaneously, some loads are controlled automatically, and environmental conditions can change electricity demand without any change in occupant behavior. A household's electrical profile is therefore the result of several interacting variables rather than a direct measurement of human activity.
Sampling resolution also affects what can be inferred. Fifteen-minute data may reveal broad changes in demand and recurring daily patterns, but it cannot necessarily distinguish short appliance events that occur within the same interval. Higher-frequency measurements can provide additional information about appliance operation, while lower-frequency utility data generally supports broader load-shape analysis. Even with more granular measurements, however, ambiguity does not disappear completely because different devices and activities can generate similar electrical patterns.
Privacy is another important consideration. Detailed electricity data can potentially reveal information about occupancy-related routines and household operation, which makes responsible data handling an important part of any residential energy analytics system. The analytical objective should be to extract useful information about energy demand while recognizing the limits of what the data can legitimately establish. A load profile can provide evidence of recurring patterns without providing a definitive account of a person's identity, activities, or intentions.
The strongest residential energy analysis combines electrical measurements with context. Weather records can help distinguish HVAC-driven demand from occupancy effects. Equipment information can explain persistent baseloads. Rate schedules can explain why flexible loads move to particular hours. Interviews, surveys, or other contextual information can provide additional evidence when researchers need to understand why a pattern changed rather than merely observe that it changed.
This approach also makes the resulting analysis more useful for energy management. Instead of labeling a particular spike as proof that someone performed a specific activity, an analyst can describe the evidence more carefully: demand repeatedly increases during a particular time window, the pattern differs between weekdays and weekends, and the change coincides with a known household schedule or equipment condition. That statement is both more defensible and more useful because it separates the measured signal from the interpretation built around it.
The same principle applies when evaluating behavioral interventions. If a utility introduces a real-time energy dashboard and the household's load profile subsequently changes, the change may be consistent with a behavioral response, but other factors should also be considered. Seasonal weather, changes in occupancy, new appliances, altered work schedules, and electricity-price changes can all affect the same measurements. Establishing a convincing feedback effect therefore requires comparison over time and, ideally, some method of controlling for competing explanations.
Residential electricity data is more informative than a monthly consumption total because interval measurements expose the timing and structure of demand. Morning transitions, midday activity, evening peaks, overnight baseloads, weekday-weekend differences, and changes following new feedback tools can all provide evidence about how a household's electrical systems interact with occupancy and routine.
But the most useful interpretation is not that the meter creates a perfect behavioral diary. It does something more precise: it records electrical consequences of a complex system in which people, appliances, controls, weather, building characteristics, and electricity prices continuously interact. Human routines can leave recognizable patterns in that system, but those patterns require context and careful interpretation before they can be attributed to a particular behavior.
For residential energy analytics, that distinction is fundamental. Interval data can help identify recurring demand patterns, reveal opportunities for load shifting, evaluate changes after efficiency measures, and show how feedback influences electricity use. Its value comes not from pretending that electricity data provides a complete picture of household life, but from using a measurable electrical signal to understand how occupancy, routines, equipment, and feedback mechanisms interact over time.
